Is your server running slowly, consuming too much memory, or struggling during traffic spikes? Effective server performance monitoring helps you identify whether CPU, RAM, disk I/O, or network activity is responsible.
Without reliable metrics, upgrading server hardware can waste money while leaving the real bottleneck unresolved.
This guide explains the essential Linux server monitoring commands, performance indicators, and practical steps for diagnosing resource problems.
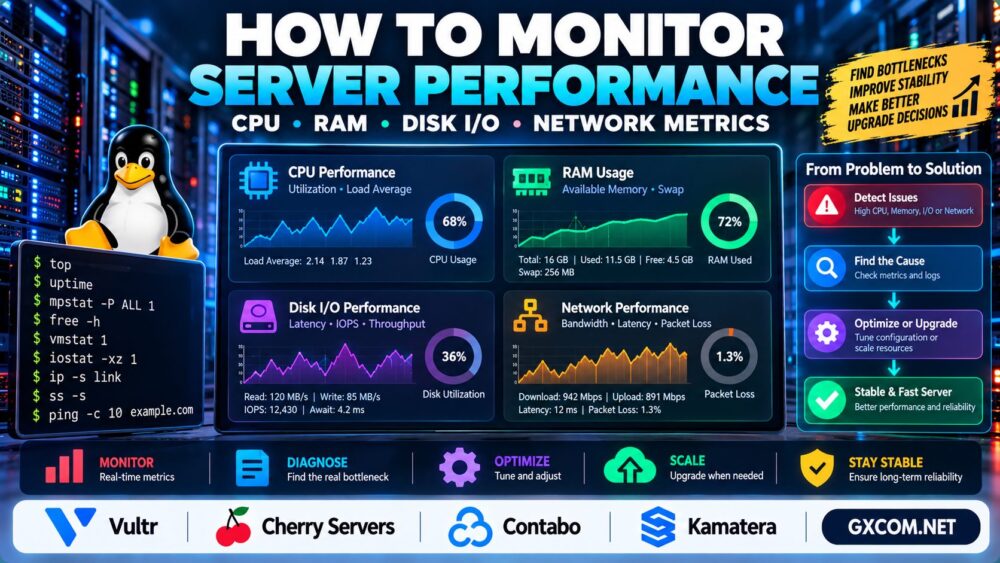
What Should You Monitor on a Server?
Start with four resource categories: CPU, memory, storage, and network.
| 资源 | 重要指标 | 常见的预警信号 |
|---|---|---|
| CPU | Utilization, load average, run queue | Sustained saturation and processing delays |
| RAM | Available memory, swap activity, memory pressure | Out-of-memory errors and sustained swapping |
| 磁盘I/O | Latency, utilization, throughput, IOPS | Slow reads, writes, and application responses |
| 网络 | Throughput, latency, packet loss, errors | Slow transfers and unstable connections |
简答: Establish normal performance baselines, monitor resource trends, and investigate sustained abnormalities rather than reacting to isolated spikes.
1. How to Monitor Server CPU Performance
CPU monitoring helps determine whether applications are limited by processing capacity.
On Linux, start with:
top
uptime
顶部 displays active processes and CPU utilization. 运行时间 includes system load averages over one, five, and fifteen minutes.
Load average is not the same as CPU utilization. It includes runnable tasks and, on Linux, tasks waiting in uninterruptible states.
Compare load with CPU capacity, then investigate process behavior and I/O waits.
For detailed per-CPU statistics, use:
mpstat -P ALL 1This command requires the appropriate monitoring package, commonly sysstat.
2. How to Monitor RAM and Swap Usage
High memory usage does not automatically mean your server needs more RAM. Linux uses available memory for filesystem caching, which can improve performance.
Check memory availability with:
free -h
vmstat 1
Focus on available memory, swap activity, and sustained memory pressure rather than the used-memory percentage alone.
Frequent swapping, application crashes, and out-of-memory events may indicate insufficient memory or inefficient applications.
For deeper capacity planning, see our 专用服务器内存需求指南.

3. How to Monitor Disk I/O Performance
Storage performance affects database queries, application loading, backups, and file operations.
Use the following command to inspect disk activity:
iostat -xz 1Depending on your Linux distribution, you may need to install sysstat.
重要指标包括:
- await: Average I/O request time, including queueing and service time.
- r/s and w/s: Read and write operations per second.
- rkB/s and wkB/s: Data throughput.
- %util: Device busy time, which requires careful interpretation on modern parallel storage.
High latency during sustained workload can indicate storage contention, but there is no universal latency threshold suitable for every application.
NVMe storage may help I/O-intensive workloads, although database configuration and query efficiency also matter.
4. How to Monitor Network Performance
Network problems can make a healthy server appear slow, especially when users connect from distant locations.
Inspect network interface statistics with:
ip -s link
ss -s
These commands provide interface counters and socket summaries.
For a basic latency and packet-loss check:
ping -c 10 example.comRemember that ICMP responses may be filtered or deprioritized. A failed ping alone does not prove that application traffic is unavailable.
For network capacity planning, read our 10Gbps vs 1Gbps Dedicated Server Comparison.
5. How to Identify the Real Server Bottleneck
Do not diagnose performance using one metric in isolation.
| 症状 | 可能的调查范围 |
|---|---|
| High CPU with growing request queues | Application processing or CPU limits |
| Low available RAM with sustained swapping | 内存压力 |
| High disk latency during database activity | Storage or database workload |
| Slow external transfers with network errors | Network interface or connectivity |
Correlate metrics with application logs, database activity, traffic patterns, and recent configuration changes.
For websites, slow response times can also result from PHP workers, inefficient queries, or caching problems.
我们的 WordPress 503 Error Troubleshooting Guide explains how resource problems may contribute to website availability failures.
6. Server Monitoring Tools: Which Should You Use?
Command-line tools are useful for immediate troubleshooting, but production environments also benefit from historical monitoring and alerts.
Common options include Prometheus with Grafana, Zabbix, and Netdata.
Choose a monitoring platform based on the number of servers, required metrics, operational complexity, and alerting needs.
Configure alerts for sustained resource pressure, service failures, storage capacity, and unusual network errors.
7. When Should You Upgrade Your Server?
Upgrade only after identifying a persistent resource limitation and checking whether software optimization can resolve it.
For flexible cloud infrastructure, Vultr 以及 卡马特拉 are relevant providers to evaluate when comparing compute configurations and scaling requirements.
Contabo may be considered when assessing VPS resource allocations and overall cost, while Cherry 服务器 is relevant for dedicated and bare-metal workloads.
Compare actual CPU allocation, memory, storage behavior, network limits, and support terms rather than advertised specifications alone.
For infrastructure selection, see our 云托管与VPS对比.
Server Performance Monitoring Checklist
- Record baseline CPU, RAM, disk, and network metrics.
- Monitor peak traffic and scheduled workloads.
- Track application and database response times.
- Configure meaningful alerts for sustained problems.
- Review capacity trends before upgrading hardware.
- Test performance after major configuration changes.
For workloads that have outgrown virtualized infrastructure, our Dedicated Server vs VPS Guide explains the trade-offs.

常见问题解答
What are the most important server performance metrics?
CPU utilization, memory pressure, disk latency, network throughput, errors, and application response times are useful starting points.
How do I check CPU usage on Linux?
使用 顶部 或 mpstat to inspect CPU utilization and process activity.
我该如何判断我的服务器是否需要增加内存?
Look for sustained memory pressure, swapping, and application failures rather than high memory usage alone.
What causes high disk I/O wait?
Possible causes include storage contention, slow devices, database workloads, and other processes waiting for I/O completion.
Can a 10Gbps port fix network latency?
Not necessarily. Port capacity and latency are different characteristics. Routing, distance, and congestion also matter.
Should I monitor a VPS differently from a dedicated server?
The core metrics are similar, but VPS performance may also depend on virtualization overhead, shared resources, and provider-imposed limits.
最终裁决
Effective server performance monitoring combines CPU, RAM, disk I/O, network, and application-level measurements.
Measure performance during real workloads, investigate persistent bottlenecks, and upgrade resources only when evidence supports the decision.
Monitor → Compare Baselines → Identify Bottlenecks → Optimize → Scale.