A slow server does not always need more CPU or RAM.
Performance problems can come from CPU saturation, memory pressure, slow disk I/O, network latency, database queries, overloaded applications or resource limits imposed by the hosting environment.
Upgrading before identifying the real problem can increase your monthly bill without making the server noticeably faster.
本指南介绍了 how to troubleshoot a slow server by checking the four major infrastructure bottlenecks: CPU, RAM, disk and network performance.
Slow Server → Measure → Find Bottleneck → Fix → Test Again
Why Is My Server Slow?
Server performance is the result of several resources working together.
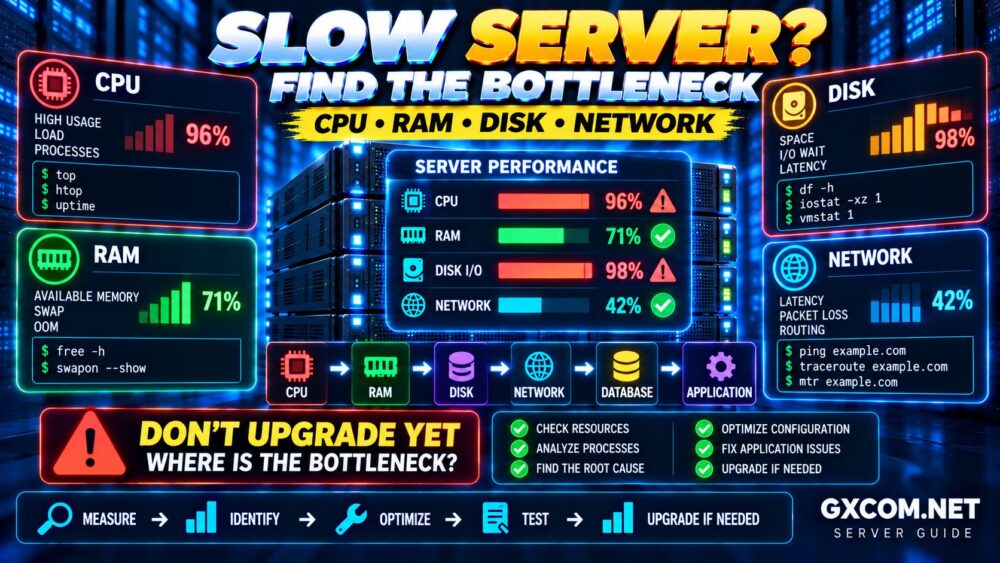
A simplified troubleshooting path looks like this:
CPU → RAM → Disk I/O → Network → Database → Application
Common causes of a slow server include:
- CPU 饱和
- 内存不足
- 大量使用交换空间
- Slow disk I/O
- Full storage
- High network latency
- 数据包丢失
- 数据库瓶颈
- 应用问题
- Too many concurrent requests
- 后台任务
- Shared VPS resource contention
The key is to identify which resource is limiting performance before changing the server.
Slow Server Troubleshooting Checklist
| 症状 | Possible Bottleneck | 检查 |
|---|---|---|
| CPU constantly near 100% | CPU | top, htop |
| Applications killed or freezing | RAM | free -h, logs |
| Heavy swap activity | RAM | free, vmstat |
| 高I/O等待 | Disk | iostat, vmstat |
| Filesystem nearly full | 存储 | df -h |
| Slow only for remote users | 网络 | ping, traceroute/mtr |
| Dynamic pages slow | Database/Application | Queries, PHP/app workers |
| Random performance drops | Contention/Workload | Long-term monitoring |
Step 1: Confirm the Server Is Actually Slow
Before changing anything, define what “slow” means.
Is the problem:
- Slow website response?
- Slow SSH connection?
- Slow database queries?
- Slow file transfers?
- High application response time?
- Intermittent freezes?
- Only slow during traffic peaks?
A website that feels slow does not automatically mean the entire server is overloaded.
For example, a poorly optimized database query can delay one page while CPU and RAM remain mostly idle.
Start by identifying the affected service and when the slowdown occurs.
Step 2: Check Server Load and Uptime
从以下内容开始:
uptime
You may see output containing three load-average values representing approximately the last 1, 5 and 15 minutes.
Load average should be interpreted in relation to the number of available CPU cores and the workload.
For example, a load of 4 means something very different on a 2-vCPU server than on a 16-vCPU server.
另外请记住:
High Load ≠ Always High CPU.
Processes waiting for disk or other resources can contribute to system load.
Step 3: Check CPU Usage
用途:
top
或者:
htop
Look for processes consuming large amounts of CPU and determine whether the usage is temporary or persistent.
Common CPU-heavy workloads include:
- PHP 工作者
- 数据库查询
- Compression
- 视频处理
- Application workers
- Backup jobs
- Malware or compromised processes
How Do You Know If CPU Is the Bottleneck?
CPU may be the limiting resource when:
- CPU usage remains consistently high
- Application response time rises with CPU utilization
- Request queues increase during traffic peaks
- Specific processes continuously consume CPU
But do not make decisions based on one short spike.
A CPU reaching 100% for several seconds during a scheduled task is different from sustained saturation during normal traffic.
Measure Trends, Not Screenshots.
More vCPU Does Not Always Mean Better Performance
Two VPS plans advertising:
4 个 vCPU + 8 GB 内存
表现可能大不相同。.
Performance may depend on:
- CPU 代数
- Clock performance
- Shared vs dedicated CPU allocation
- Host-node contention
- 虚拟化的局限性
- Application parallelism
An application that depends heavily on single-thread performance may not become twice as fast simply because you double the number of virtual cores.
More Cores ≠ Automatically Faster Application.
Step 4: Check RAM Usage
用途:
free -h
Do not focus only on the “used” memory figure.
Linux intentionally uses available memory for caching, which can improve performance.
请注意:
- 可用内存
- Swap usage
- Application memory growth
- Out-of-memory events
Used RAM ≠ Memory Problem.
How Do You Know If RAM Is the Bottleneck?
Possible signs include:
- Very low available memory
- Heavy or continuous swapping
- Processes being killed by the OOM killer
- Applications becoming unstable under load
- Performance dropping as memory pressure increases
Check system logs for out-of-memory events rather than assuming every high-memory reading means the VPS needs an upgrade.
Step 5: Check Swap Usage
Check swap with:
swapon --show
free -h
Swap can act as a safety buffer when physical memory is under pressure.
However, disk-backed swap is much slower than RAM.
If an active workload is constantly moving memory between RAM and swap, performance may deteriorate significantly.
Swap ≠ Extra High-Speed RAM.
Heavy swapping can indicate insufficient RAM, but it can also result from application behavior or system configuration. Investigate before upgrading.
Step 6: Check Disk Space
Before performing advanced disk benchmarks, check something much simpler:
df -h
A nearly full filesystem can create serious problems for:
- 数据库
- 日志文件
- 临时文件
- 更新
- 应用
Common causes of unexpected storage growth include:
- Old backups
- Application logs
- 数据库增长
- User uploads
- 容器镜像
- 临时文件
Do not wait until the filesystem reaches 100% utilization.
Step 7: Check Disk I/O
A server can have low CPU usage and plenty of free RAM while still feeling extremely slow because processes are waiting for storage.
Tools such as iostat can help investigate disk activity.
On Ubuntu/Debian, it is commonly provided by the sysstat package:
sudo apt install sysstat -y
然后:
iostat -xz 1
Metrics vary by system, but you are generally looking for signs of sustained storage pressure, high latency or processes spending significant time waiting for I/O.
SSD vs NVMe: Does Storage Matter?
Yes—especially for I/O-intensive workloads.
Fast storage can benefit:
- 数据库
- Busy WordPress websites
- Search workloads
- Large application logs
- Build processes
- 虚拟机
However, simply seeing “NVMe” in a VPS specification does not guarantee identical performance across providers.
Underlying hardware, virtualization, storage architecture and contention all matter.
If storage performance is important to your workload, compare more than the marketing label.
Step 8: Check I/O Wait
High CPU wait time associated with storage can indicate that applications are spending time waiting for I/O rather than performing useful computation.
Tools such as:
top
vmstat
iostat
can help investigate this.
If CPU utilization appears modest but applications remain slow and I/O wait is consistently elevated, storage deserves closer attention.
Step 9: Check Network Latency
If CPU, RAM and storage look healthy, investigate the network.
Basic latency testing can start with:
ping example.com
Latency is influenced by physical distance, routing and network conditions.
A server in Europe will naturally have higher latency for many users in Asia or North America than a server geographically closer to them.
This is why server location matters even when the hardware is identical.
Step 10: Check the Network Path
Tools such as:
traceroute example.com
or MTR can help investigate the network path between systems.
Network troubleshooting may reveal:
- High latency
- Routing problems
- 数据包丢失
- Problems outside your VPS
Be careful when interpreting individual intermediate hops because some routers deprioritize or limit diagnostic traffic without affecting normal forwarding.
1 Gbps Port Does Not Mean 1 Gbps Application Performance
A VPS advertised with a 1 Gbps network port does not guarantee that every file transfer or website request will run at 1 Gbps.
Real-world throughput may depend on:
- 服务提供商政策
- Shared network capacity
- 路由
- Remote server limits
- 协议开销
- 延迟
- 应用程序性能
Port Speed ≠ Guaranteed End-to-End Throughput.
Step 11: Check the Database
If only dynamic pages are slow, the server itself may not be the main problem.
Database issues can include:
- 查询速度慢
- 缺失的索引
- Too many queries
- Lock contention
- Insufficient database memory
- 大桌子
- Application plugins generating inefficient queries
This is particularly important for WordPress and other database-driven applications.
A database bottleneck can make a website feel slow even when overall CPU utilization appears reasonable.
Step 12: Check the Application
Infrastructure is only one layer of performance.
A slow application can result from:
- Inefficient code
- 插件太多了
- 外部 API 调用
- 数据库查询速度慢
- No caching
- Background tasks
- Misconfigured workers
For WordPress specifically, use our WordPress 运行缓慢的故障排除指南 to investigate application-level causes.
Step 13: Check What Changed
If the server was fast yesterday and slow today, ask what changed.
例如:
- Traffic spike?
- Software update?
- New plugin?
- Backup running?
- Database growth?
- New cron job?
- Security incident?
- Configuration change?
A timeline can often identify a performance problem faster than random tuning.
When Did It Start? → What Changed?
Step 14: Monitor Performance Over Time
A single snapshot cannot tell you what happened three hours earlier.
For recurring performance problems, collect historical data for:
- CPU
- RAM
- Swap
- 磁盘使用情况
- 磁盘I/O
- 网络流量
- 应用程序响应时间
- 数据库性能
This lets you compare server performance with traffic and workload changes.
Monitoring Turns Guessing Into Evidence.
Should You Upgrade Your VPS?
Upgrade only when the evidence shows that additional resources are likely to solve the bottleneck.
| 发现 | Possible Action |
|---|---|
| Sustained CPU saturation | Optimize workload or add CPU capacity |
| Memory pressure / OOM | Optimize memory use or add RAM |
| Heavy disk bottleneck | Optimize I/O or move to faster storage |
| 网络延迟 | Consider closer region/CDN/network solution |
| 数据库查询速度慢 | Optimize database first |
| Application bottleneck | Fix application before upgrading |
If your current VPS consistently lacks the resources your workload requires, moving to a stronger plan can make sense.
我们的 最佳VPS主机 guide can help when the limitation is genuinely infrastructure-related.
When Should You Consider a Dedicated Server?
A growing workload may eventually need more predictable resources than a typical shared-vCPU VPS can provide.
A dedicated server can be useful for workloads requiring:
- Consistent CPU resources
- 大量内存
- High sustained disk activity
- More control over hardware
- Heavy databases or applications
But dedicated servers are not automatically faster for every workload.
Compare the architectures before migrating using our 专用服务器与VPS的对比 指南。.
Slow Server Troubleshooting: What Not to Do
Do Not Immediately Add RAM
RAM will not solve a network latency or CPU bottleneck.
Do Not Immediately Add CPU Cores
Additional cores will not fix slow storage or inefficient database queries.
Do Not Reboot Every Time
A reboot may temporarily hide a problem without identifying its cause.
Do Not Run Random Benchmarks on Production
Some benchmarks can create heavy load and make the problem worse.
Do Not Change Multiple Things at Once
If you change CPU allocation, database configuration, caching and application settings simultaneously, you may not know which change actually helped.
Measure → Change One Thing → Test Again.
Quick Slow Server Diagnostic Workflow
When a server becomes slow, use this order:
1. DEFINE THE PROBLEM
What exactly is slow?
2. CHECK CPU
Is processing capacity saturated?
3. CHECK RAM
Is there memory pressure or swapping?
4. CHECK DISK
Is storage full or I/O constrained?
5. CHECK NETWORK
Is latency or packet loss involved?
6. CHECK DATABASE
Are queries causing delays?
7. CHECK APPLICATION
Is software itself inefficient?
8. COMPARE HISTORY
What changed when the problem started?
9. OPTIMIZE
Fix the identified bottleneck.
10. UPGRADE ONLY IF NECESSARY
Slow Server FAQ
Why is my server slow even with low CPU usage?
The bottleneck may be RAM, disk I/O, network latency, database queries or the application itself. Low CPU usage does not guarantee that the server has no performance bottleneck.
How do I know if my server needs more RAM?
Look for persistent memory pressure, heavy swapping, out-of-memory events and application instability. High “used” RAM alone is not enough evidence because Linux uses memory for caching.
Can a full disk make a server slow?
Yes. Very low free disk space can interfere with logs, databases, temporary files and applications. Monitor disk usage before storage becomes completely full.
Does NVMe make a VPS faster?
NVMe can significantly benefit I/O-sensitive workloads, but overall performance also depends on the provider's storage architecture, CPU, virtualization, database and application.
Why is my website slow when server resources look normal?
The problem may be application-level, such as slow database queries, plugins, external API calls, caching or inefficient code.
Should I upgrade my VPS if it is slow?
Only after identifying the bottleneck. Upgrading can help when resources are genuinely insufficient, but it may not fix application, database or network problems.
最终建议
When troubleshooting a slow server, do not start with the hosting provider's upgrade button.
Start with evidence.
CPU
Is processing capacity saturated?
↓
RAM
Is the system under memory pressure?
↓
DISK
Are applications waiting for storage?
↓
NETWORK
Is latency or routing slowing communication?
↓
DATABASE
Are queries delaying dynamic requests?
↓
APPLICATION
Is the software itself the bottleneck?
The best server upgrade is the one supported by actual performance data.
DON'T UPGRADE YET.
FIND THE BOTTLENECK FIRST.